MeasureLesson 5 of 9
MCP server analytics: published, now what?
Getting listed in a catalog is not the end of the work, because the catalogs tell you almost nothing about who uses your listing: ChatGPT provides no usage information at all, and Claude provides very little. The only way to know is to track the traffic itself: which AI agents call the server, which tools they use, how often, and what fails. The number that matters most is how many people are behind those calls. Without it you cannot tell whether a listing brings a steady stream of users or a handful of curious testers, whether usage is growing month over month, or whether the channel is worth the continued investment. User counts in this channel are partly estimated, since an agent does not always identify the person behind a call, so treat them as approximate, the way you treat modeled users in web analytics. Errors only make sense split by tool and agent, so “the ChatGPT integration seems off” should become one tool, one error, one time. Uptime checks matter too, because they watch the server even when nobody is calling it, so you find an outage before your stakeholders do. This lesson walks through the usage reports one by one and ends with five questions to answer on Gold Keeper’s data.
Why the catalogs are not enough
Section titled “Why the catalogs are not enough”Nobody tells you how often ChatGPT picked your server, which tools Claude called or how many of those calls failed. That data is in the traffic, but no single source gives the whole picture, so you have to combine several signals. Every agent request reaches the server as a tool call, so anything that sits in front of the server can record which agent made the call, which tool it asked for, whether it succeeded, and roughly which user was behind it. Widgets add a second signal: a widget is a web page, so it can report when it loads and what the user does inside it, much like an analytics tag on a landing page. Put together, the two tell you how often the assistant showed your card rather than answering from the tool response alone, and which buttons and links people actually used.
MCP metrics to watch: the recommended KPIs
Section titled “MCP metrics to watch: the recommended KPIs”Whatever tool you track with, the same handful of numbers answers the stakeholders’ questions. Group them the way you group SEO metrics: reach, engagement, quality and outcomes.
| KPI | What it measures | The SEO twin | What to watch for |
|---|---|---|---|
| Tool calls | How often agents call the server’s tools | Impressions | The trend month over month, and a step change after each new listing |
| Calls by agent | The share of calls from ChatGPT, Claude, Gemini and the others | Traffic by search engine | One agent growing while others stay flat points to that platform, not the server |
| Active users | People behind the calls in a week or a month, approximate | Users | Growth, and the gap between calls and users: a few people making all the calls |
| Returning users | Share of users who come back in a later week | Returning visitors | Whether the server is a habit or a one-time curiosity |
| Calls per user | Average tool calls per active user | Pages per session | Depth of use; a rise usually means a tool became part of a workflow |
| Tool coverage | Share of tools called at least once in the period | Pages with impressions | Tools with no calls at all: the agent never picks them, often a description issue |
| Success rate | Share of calls that return a result, per tool and per agent | Crawl errors | Any tool or agent below the rest; one failing tool can sink a review or a listing |
| Latency (p95) | How long the slowest 5% of calls take | Server response time | Spikes, and tools much slower than others; agents give up on slow tools |
| Uptime | Share of time the server answers, measured from outside | Uptime monitoring | Any outage, and its time of day; nobody may be calling when it happens |
| Widget render rate | Share of widget-capable calls where the assistant actually showed the widget | Rich result shown | Hosts that answer from text instead of showing the card |
| Link click-through rate | Links opened from tool results, divided by the calls that returned links | Click-through rate | Which tools and agents send people back to the site |
| Conversions | Sign-ins, purchases or sign-ups that start in the conversation | Goal completions | The number the business cares about; tie it to a value where you can |
Three rules make these numbers useful in a report:
- Compare like with like. Read each KPI against the previous period of the same length, and mark the dates when a listing went live or a description changed. A change without a date next to it is a guess.
- Segment by agent and by tool. Totals hide the story. “Errors are up” means little; “
buy_goldfails for Claude since Tuesday” is something an engineer can fix. - Pick three for stakeholders. Twelve numbers are for you. For the monthly report, choose one reach metric (tool calls or active users), one quality metric (success rate or uptime) and one outcome (link clicks or conversions), and keep the same three every month.
Users are the least precise number on the list, because an agent does not always say who the person behind a call is. Report them as approximate, and lean on calls and outcomes when the user count moves in a way you cannot explain.
Widgets and links get their own lesson, lesson 6. The rest of this one covers usage, users and reliability.
Who calls which tools, from which agent
Section titled “Who calls which tools, from which agent”Two views answer most usage questions, whatever tool draws them.
Tool calls over time, by tool. Tools are the queries of this channel: they show what agents ask the server for. Plot daily calls per tool and look at the mix. Then take one tool and split its calls by result (success, tool error, cancelled, server error) to see whether it works when it is picked. Keep a list of every tool the server offers next to the chart: a tool with no calls at all is the agent channel’s version of a page that never gets an impression, and usually a sign that its description does not match what users ask.
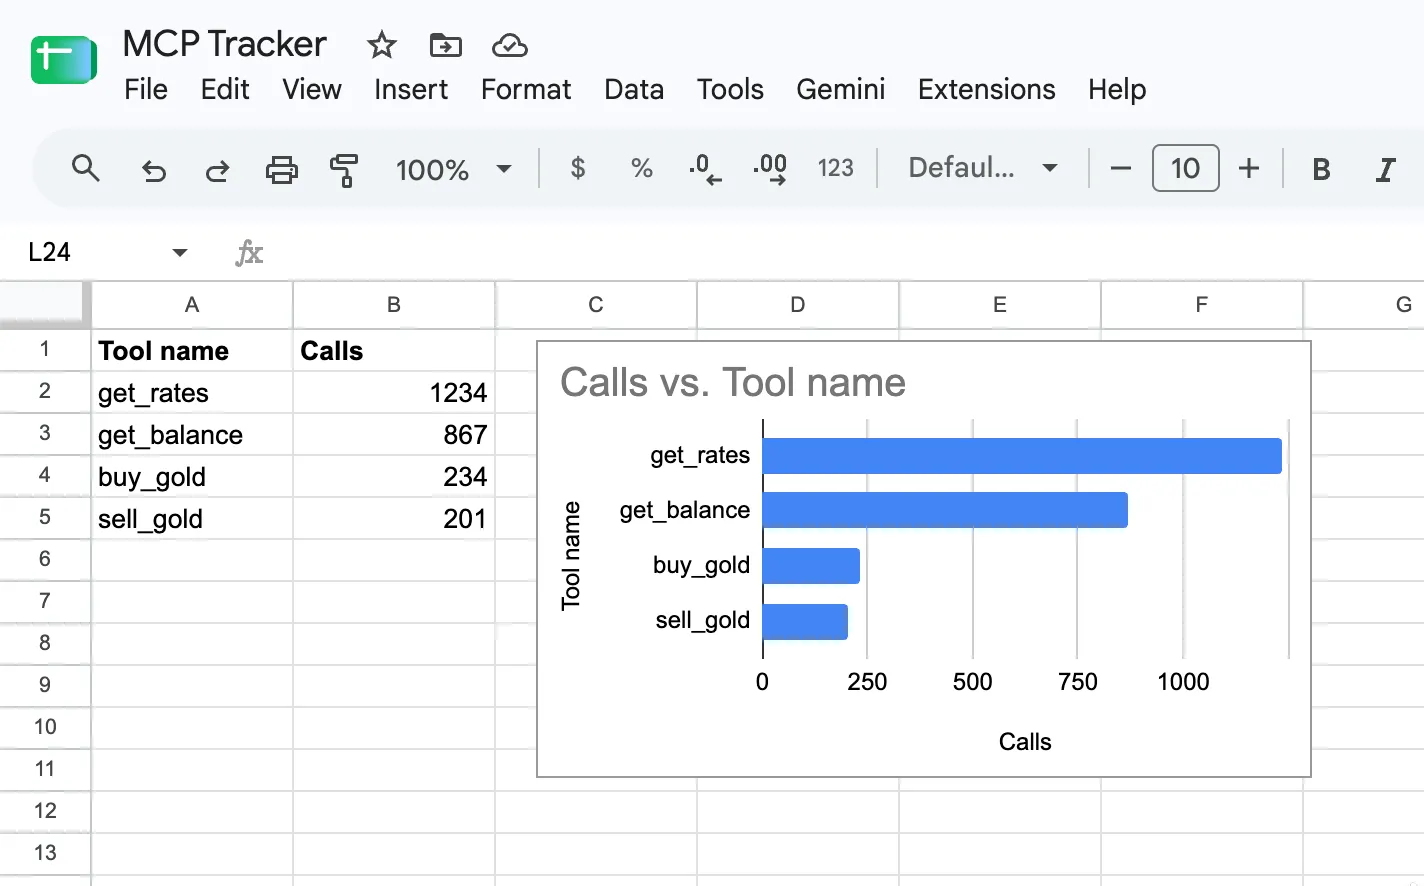
Calls per tool: the first view of what agents use the server for.
Tool calls over time, by agent. Plot the same calls split by ChatGPT, Claude and the other hosts, once as counts and once as shares of the total. The share view is the one to watch after a new listing goes live: if the Claude listing was published on the 3rd, Claude’s share should move after the 3rd. One agent growing while the others stay flat usually points to a listing or a change on that platform, not to the server itself.
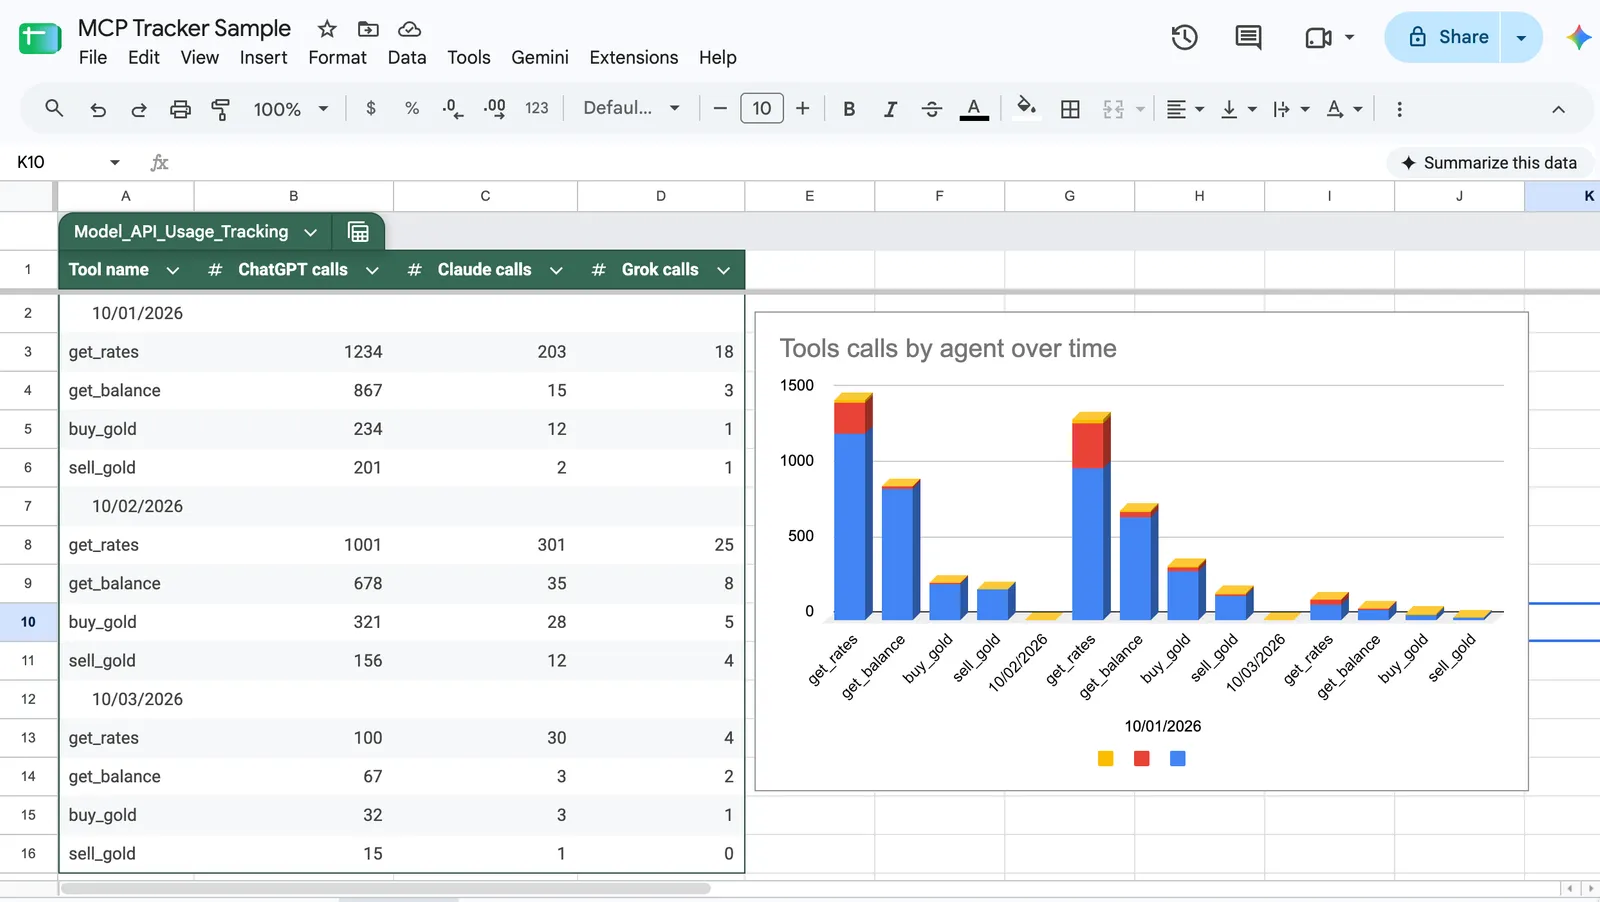
Tool calls by agent over time, kept in a spreadsheet.
Why call counts overstate usage
Section titled “Why call counts overstate usage”A tool call is not a visit. One person can make a tool run many times in a single conversation: they ask again with a different date, the model retries after an error, or it calls the same tool once per item in a list (“rates in USD, then GBP, then EUR”). Some agents also call a tool in the background to check it before they answer. A few heavy users, or one automated test, can make a tool look ten times more popular than it is.
So never read calls alone:
- Put users next to calls. Calls per user shows how much of the volume comes from a few people. A jump in calls with flat users is a few people calling more, not more people.
- Count distinct conversations or sessions where the tool was used at least once, the way you count sessions rather than page views.
- Check the top callers. If one user, one session or one test account makes a large share of the calls, exclude it from the stakeholder report, as you would filter internal traffic in GA4.
- Watch repeats after errors. Calls to the same tool seconds apart, after a failure, are retries. They inflate volume and hide the real problem: the error.
How many users, and why the count is approximate
Section titled “How many users, and why the count is approximate”Counting people is harder here than on a website. There are no cookies: the calls come from the assistant’s servers, not from the user’s browser, so nothing is stored on the user’s device to recognize them the next time. However, ChatGPT sends a user identifier with each call. Claude and most other hosts send none. When the server uses OAuth sign-in, the token says who the user is; when it does not, some calls can only be tied to a person through a widget or a link that person opened in their own browser.
Expect this number to be the least precise, and say so in your reports. A server with OAuth, widgets or links is easier to count than one without. Gold Keeper’s sign-in tokens carry no readable user id, so its users can be counted only from ChatGPT’s identifier and from people who opened its widget or a link; everything else has to be estimated. Report counted and estimated users separately, the way GA4 separates observed from modeled users, and never add them into one figure.
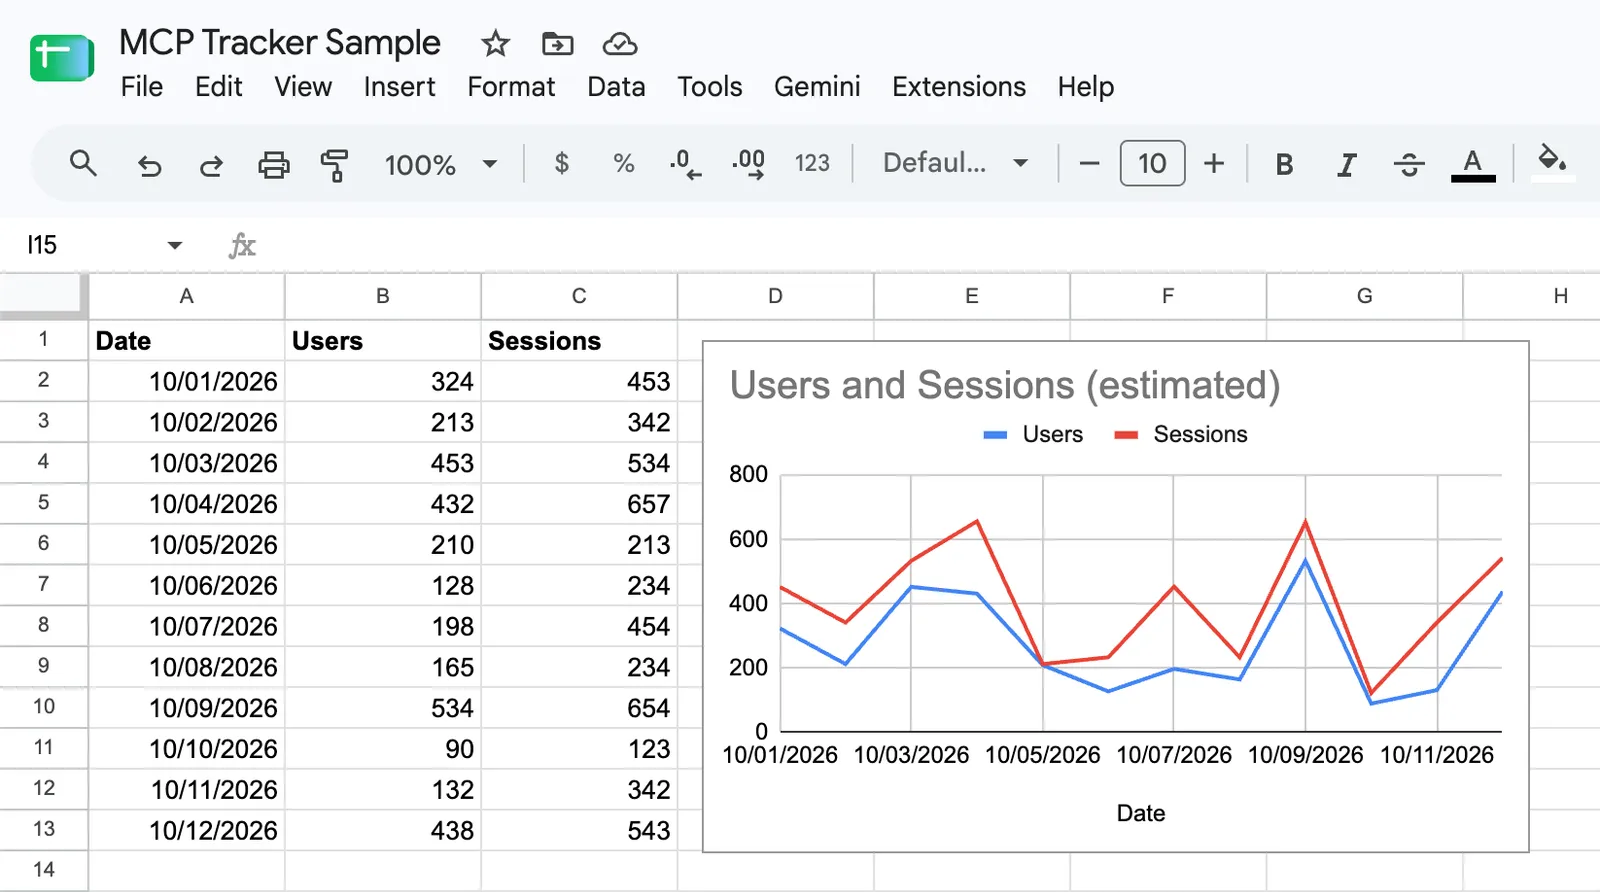
Users and sessions are estimates: label them that way in every report.
Errors by agent: the reliability section
Section titled “Errors by agent: the reliability section”Errors need the same treatment as calls: split them until they point at one thing.
- Over time, by category. Plot errors per day next to response time, and split them by kind: the tool ran and returned an error, the call was cancelled, the server refused the request (4xx), the server failed (5xx), or it did not answer at all. Each kind has a different owner: a tool error is usually the tool’s logic or its input, a 5xx is the server, no answer is hosting.
- By tool. A table of each tool’s calls, errors, error rate and most common error kind, sorted by errors. One tool usually accounts for most of them.
- By agent. Filter the same table to one assistant at a time. A tool that fails for one agent and works for the others usually means that agent reads a description or an argument differently, which lesson 7 fixes.
On Gold Keeper, sell_gold always fails. That is deliberate, so there is always a real error to
look at.
MCP uptime and monitoring
Section titled “MCP uptime and monitoring”A website can be down at 3 a.m. with no visitors to notice. The same goes for an MCP server, with one difference: you never know when an agent will call it. A reviewer may test it on a Sunday, and a user may ask for it in the middle of a task. If the server fails at that moment, the assistant answers without it or tells the user it cannot help, and nobody tells you. Monitoring is how you find out first.
Good practice, whatever tool runs the checks:
- Check from outside. Run the checks from outside the company’s network, the way agents reach the server, at the public URL that is listed in the directories.
- Speak MCP, not just HTTP. A web page that answers
200proves little. A useful check connects as an MCP client and lists the server’s tools, so it fails when the MCP layer is broken even if the web server is up. - Sign in like a user. If tools need OAuth, check with a dedicated monitoring account, so a broken sign-in shows up as a failure. Keep that account separate from the reviewers’ test accounts.
- Check often. Every minute or every few minutes. A check once an hour misses short outages, which are the ones users still hit.
- Record time as well as status. A server that answers in 20 seconds is down for an agent that gives up sooner. Track response time and treat slow as a problem, not a pass.
- Alert a person. Send failures to someone who can act, with a second check before alerting so a single blip does not wake anyone up.
- Watch for changes. Compare the tool list and descriptions with the version submitted to the directories. An unannounced change can cost a listing (lesson 4).
- Report it. Uptime percentage and the number of outages per month belong in the stakeholder report, like crawl errors in an SEO report.
Monitoring and usage data work together. This is how “the ChatGPT integration seems off” becomes a specific failing tool, with a specific error at a specific time: the uptime history shows when, the errors by tool show what, and the split by agent shows for whom.
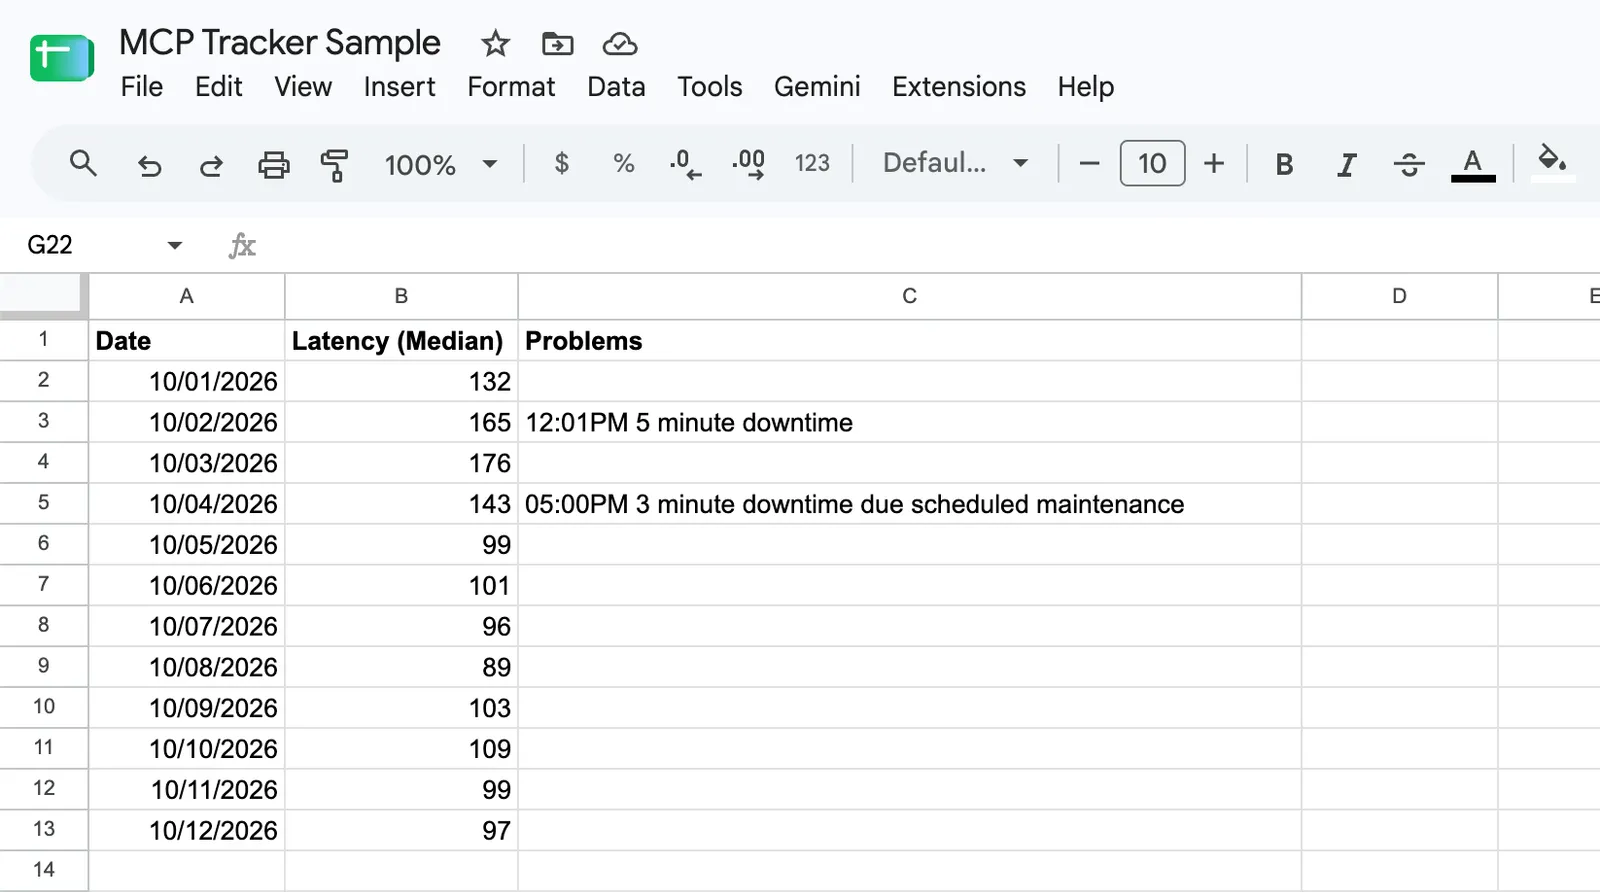
Latency and incidents by day: the uptime log stakeholders ask about.
Your task
Section titled “Your task”Gold Keeper is a dummy MCP server, safe to experiment with: the prices are demo prices, nothing is traded, no money moves and it never asks for payment details.
Answer the five questions for Gold Keeper from the screenshots in this lesson, then for the server you work on, from whatever analytics it has. Write each answer the way you would put it in a stakeholder report, with the view it came from.
- Which agent sends the most tool calls, and is its share growing? Use calls by agent, as shares, against the previous period.
- Which tool is called most, and which tools have no calls at all? Compare calls by tool with the full list of the server’s tools.
- How many users does the server have, and how sure is that number? Separate counted from estimated users, and check calls per user for a few heavy callers.
- Which tool fails most, and does it fail for every agent or only one? Use errors by tool, then the same view for one agent at a time. On Gold Keeper you already know which tool should top the list.
- Was the server up for the whole period, and when was the last outage? Use the uptime history.
Check yourself
Section titled “Check yourself”Why report estimated users next to the counted ones instead of adding them up?
Because they are different kinds of numbers. Counted users rest on signals such as a sign-in or ChatGPT’s identifier. Estimated users cover calls no signal can attribute, modeled from traffic that was identified, like GA4’s modeled users. Adding them would hide how much of the figure is a guess.
A stakeholder says “Claude can’t use our server anymore”. Where do you look first?
The uptime history for when it started, then errors by tool for Claude only, to see which tool fails and with which kind of error. If the uptime checks pass and only Claude’s calls fail, the server is up and the problem is in how Claude uses one tool.
What does a tool with no calls tell you?
That agents see the tool in the list and never pick it, like a page that is indexed and gets no impressions. Its description is the first suspect, which is the subject of lesson 7.
Go deeper
Section titled “Go deeper”- After you publish: measure the traffic in the MCP Registry guide
- What analytics you get after launch in the Claude guide
- The Model Context Protocol specification, for what a tool call is